
Open a session
Route, power curve, planned against done, graphs, drift and splits for one session, plus downloads and Strava.
Updated 4 November 2026
Every session in Form has its own page: the headline numbers, the route, how it compared with what you planned, graphs of everything your device recorded, and the laps. For a ride with power it adds a power curve, drift and time-at-power analysis. It is also where you rename a session, download its file, send it to Strava or delete it, and the quickest way to ask the coach about it.
Where to find it
Where to find it
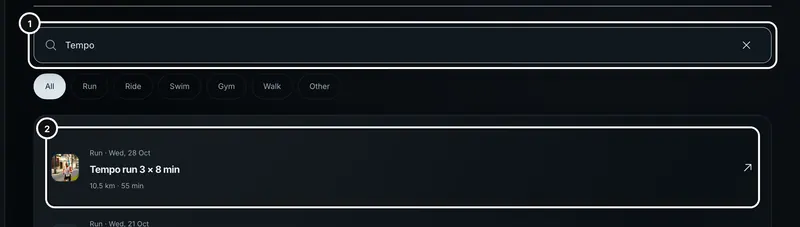
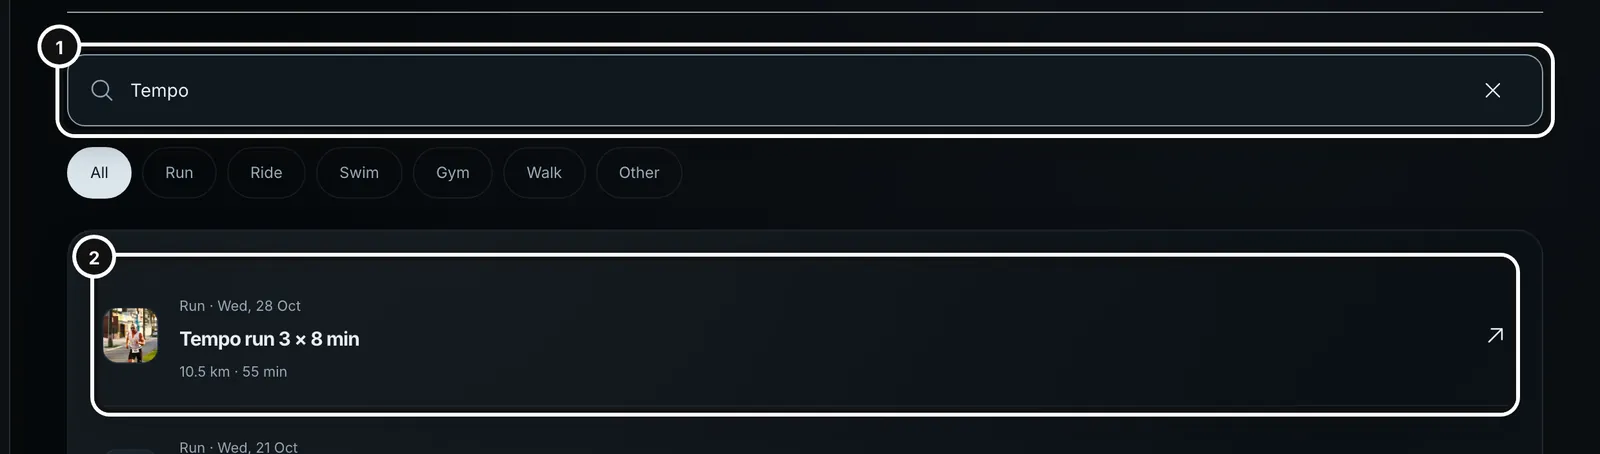
1Open Activities and click any session. To find an older one, type part of its name in Search activities, or pick a sport filter, then click the session.
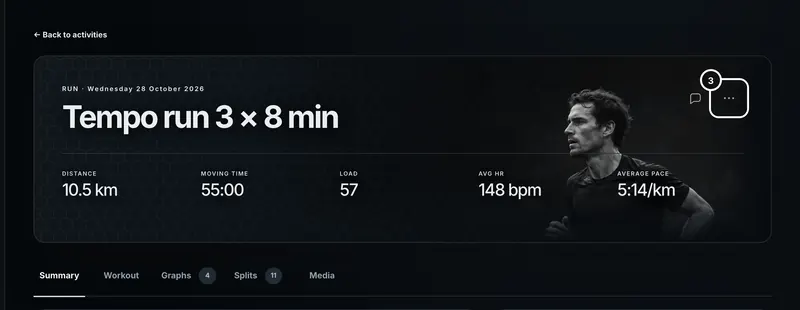
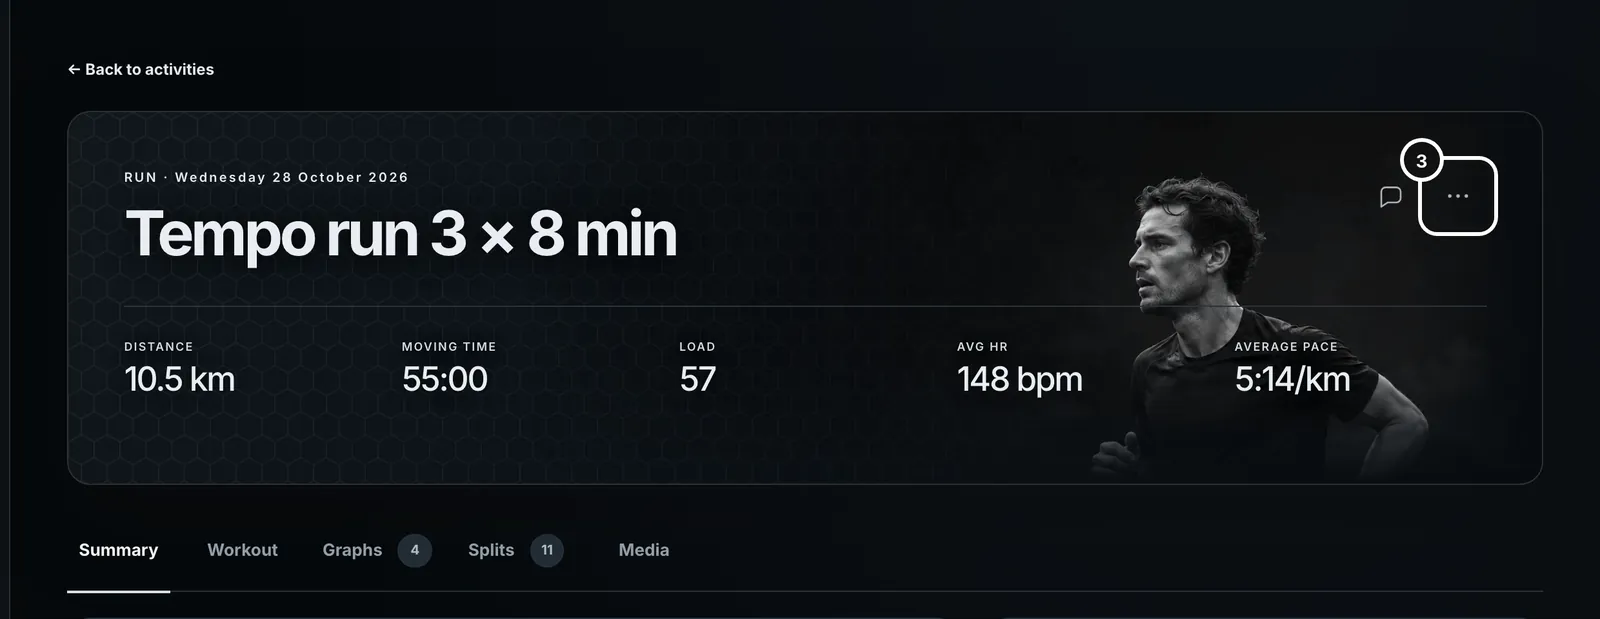
2The session page opens. The … button at the top right is Session actions; the speech bubble beside it is Discuss session.
You can also open a session from Overview (Done today, Recent activity, or a day in This week), from a done session on the Calendar, or from Session ↗ on any Trends chart.
The top of the page
The dark header shows the sport and date, the session’s name, and five figures:
- Distance (Virtual distance for a trainer ride on a Form course) and Moving time (Timer time for an uploaded file).
- Load, with a note under it when Form estimated it. “from heart rate” means no power or pace was available, so Form scored the session from your average heart rate against your threshold. “from effort (RPE)” means it came from how hard you said the session was. Intervals.icu sessions keep Intervals.icu’s load.
- Avg HR.
- Average pace for runs and swims, or Weighted power for rides. A dash means it wasn’t recorded.
Under the name, a Garmin session names the Garmin device it came from.
Discuss session
The speech-bubble button opens a new coach chat with this session already attached, so the coach answers from its numbers, laps and your notes. You can also attach a session from any chat with @. See “Ask the coach about a session”.
The Session actions menu
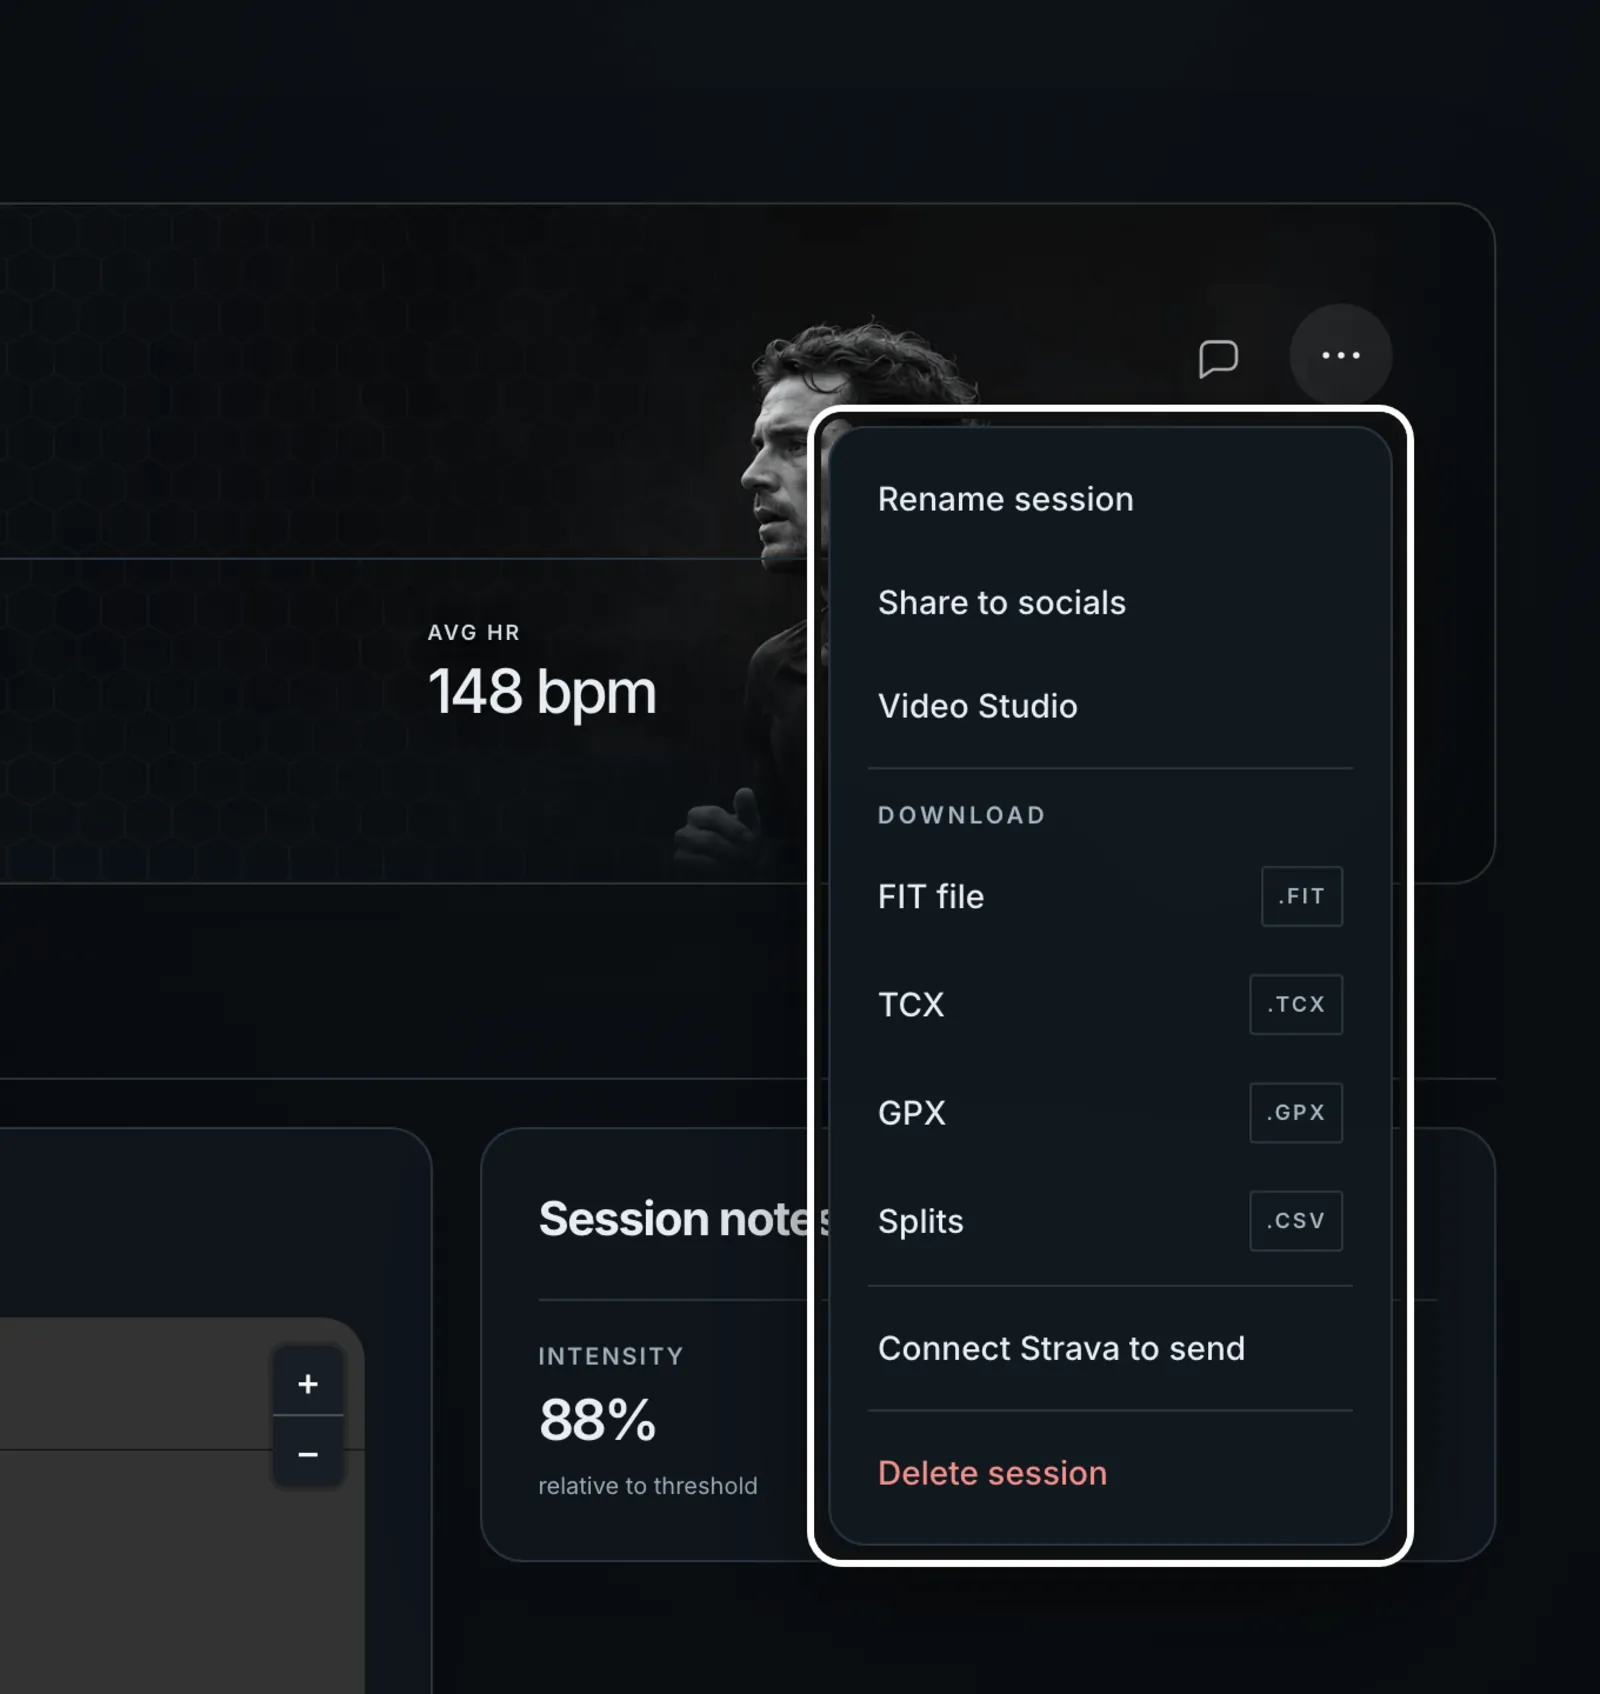
- Rename session gives it your own name. This is your label; it does not change the source.
- Share to socials appears once the session has photos or videos. See “Share a session”.
- Create ride video (rides) and Video Studio (rides and runs) open Form’s video tools for the session.
- Download offers FIT file, TCX, GPX and Splits (.CSV). GPX only appears when the session has a route and wasn’t a trainer ride. Press one and the menu says “Preparing…” until the file is ready.
- Send to Strava, or Connect Strava to send if you haven’t connected it yet. Nothing goes to Strava until you press Send. See “Send a session to Strava”.
- Delete session, in red at the bottom.
Summary
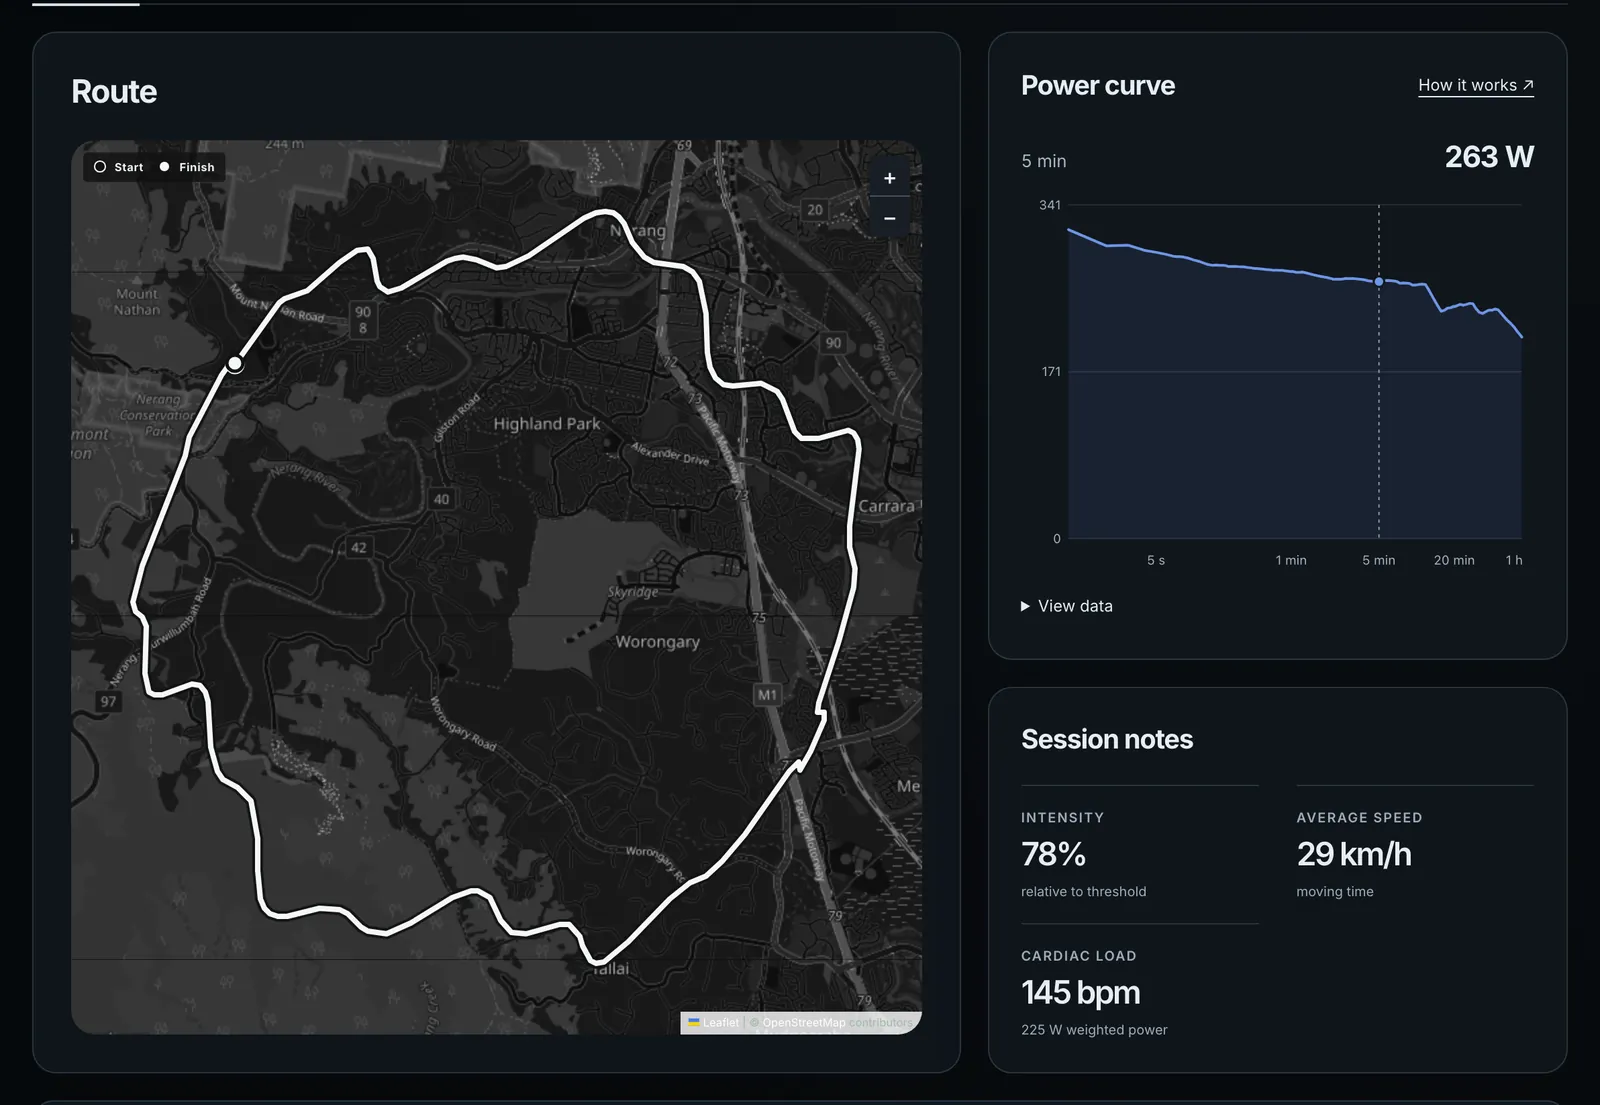
- Route is the map, when the session has GPS. Zoom with + and −. Indoor sessions have none.
- Power curve (rides with power) is your best average power for every length of effort in this ride, from a few seconds to the whole ride. Move along it to read one, such as 263 W for 5 minutes. How it works ↗ explains it.
- Session notes shows your session RPE or how it felt if you entered it, Intensity relative to threshold, average pace (or speed for rides), and for rides with power and heart rate, Cardiac load: your average heart rate beside your weighted power.
- Further down, Activity statistics lists everything the recording holds, grouped as Time, Energy, Power, Heart rate, Speed, Cadence and Elevation, and zone cards show your time in each power or heart-rate zone. A trainer ride adds a virtual ride summary with any segment efforts.
Workout
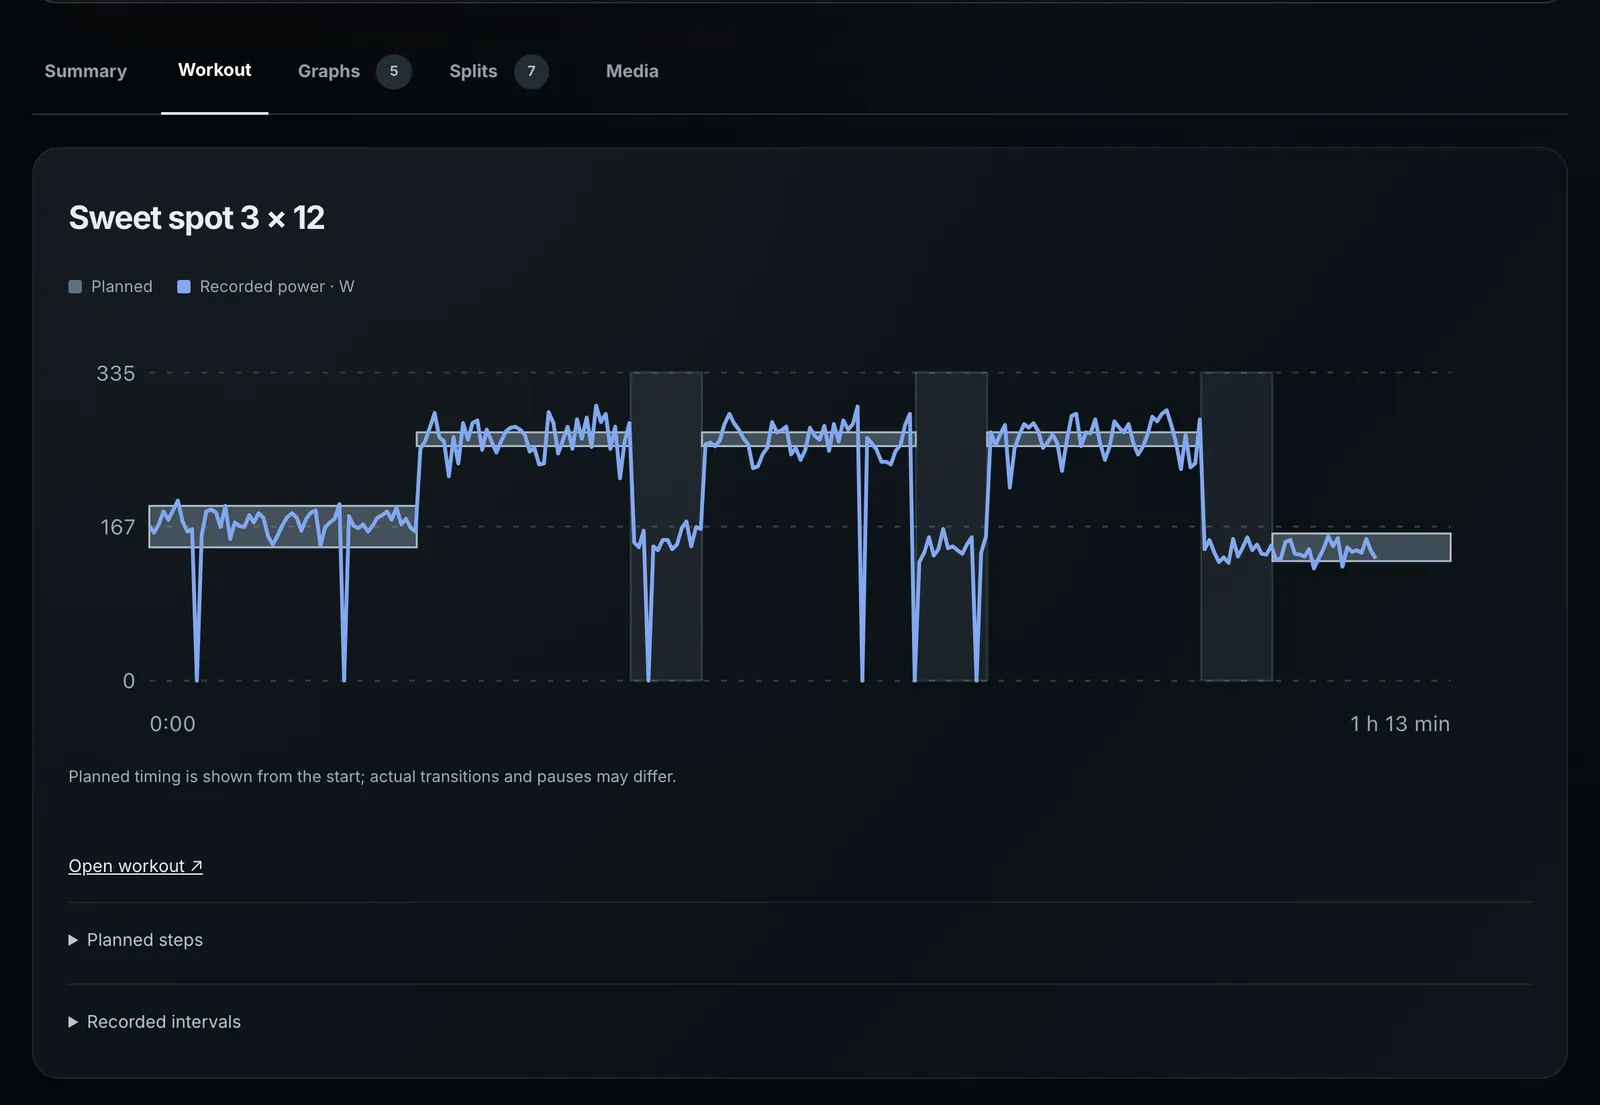
Workout compares the session with what you planned. When it completed a planned session, the chart draws each planned step as a block from the start, with a power target in watts as a band, and your recorded power (or heart rate) over it. Planned timing runs from the start, so a long pause shifts the rest. Open workout ↗ shows the planned session on the calendar, Planned steps lists its steps and targets, and Recorded intervals lists the laps you actually did. If your watch ran a workout of its own, its steps show as Device workout targets. A session with no plan shows its recorded heart rate or power and its laps.
Graphs
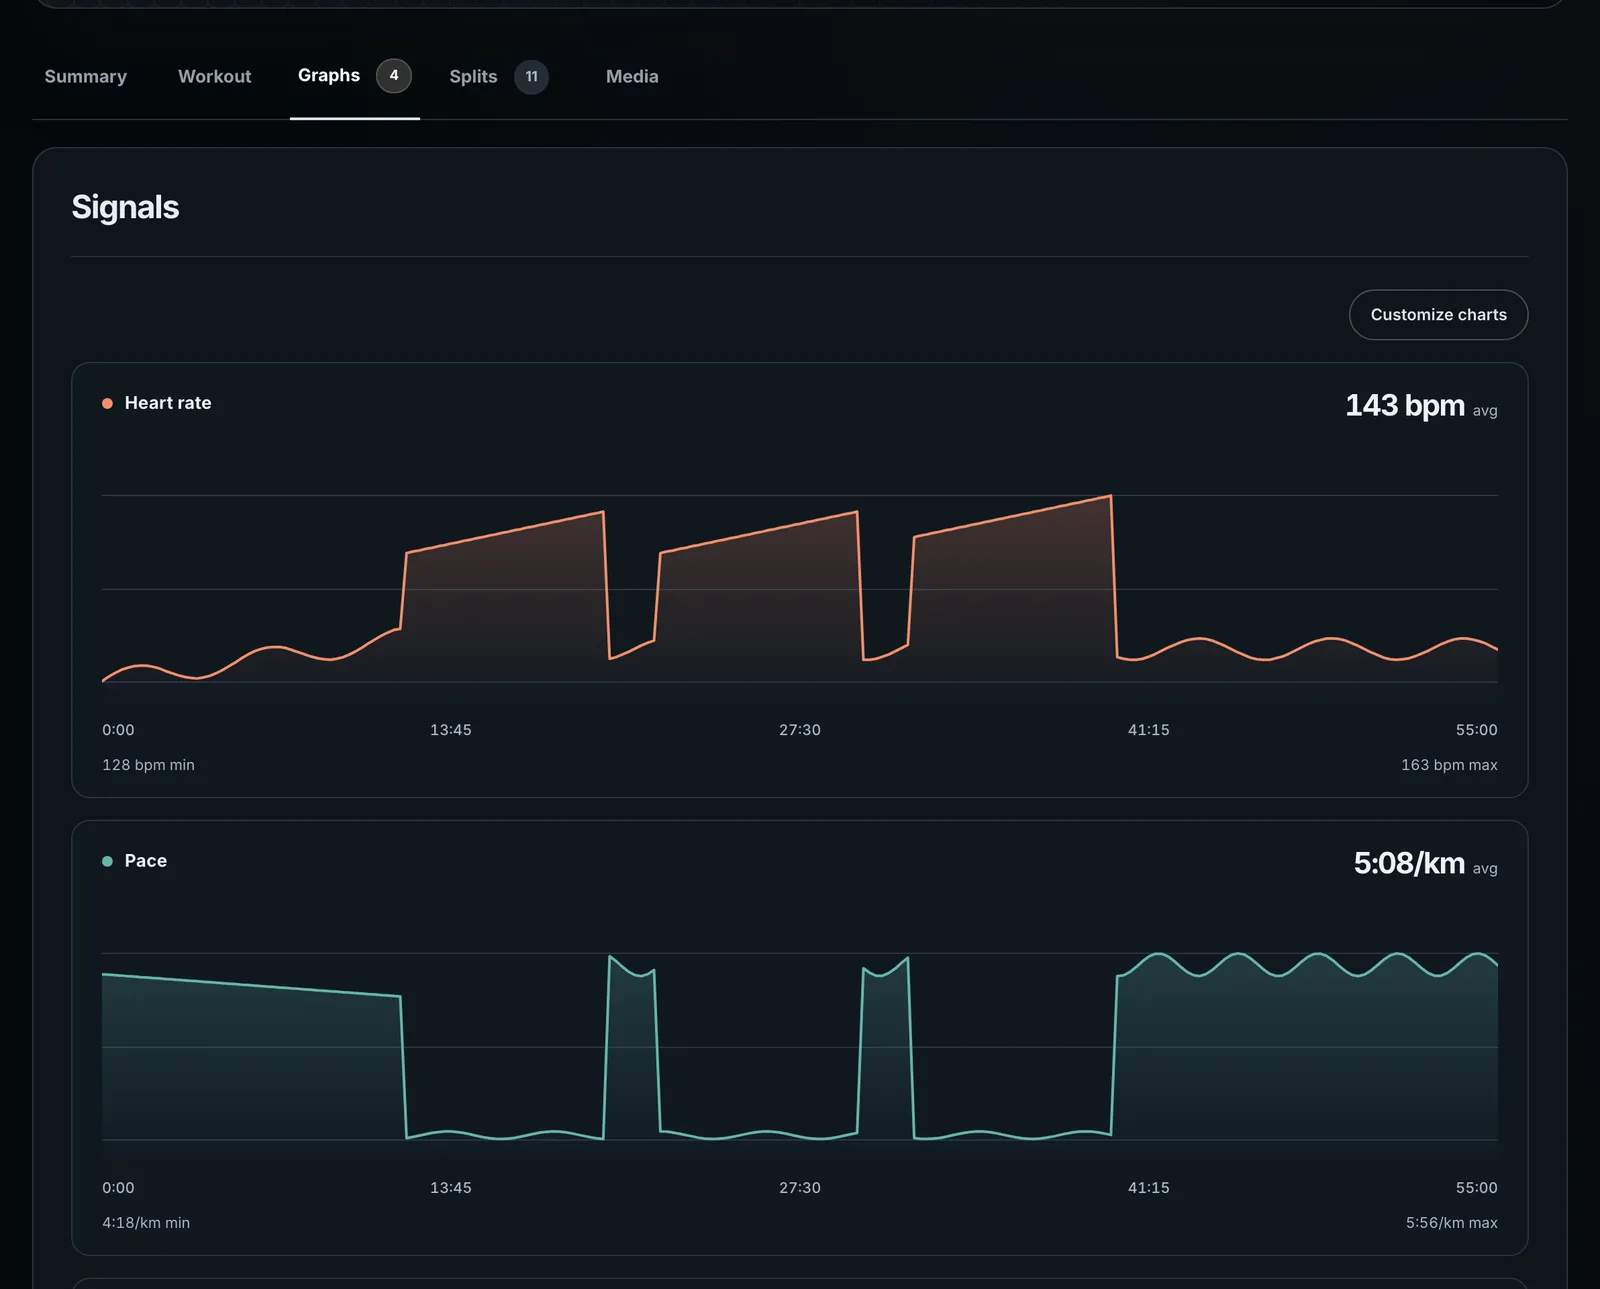
Graphs stacks one chart per signal the session actually has, with a shared cursor: move across one chart and every chart shows the same moment. Customize charts lets you hide and show them. The signals Form can draw are heart rate, power, speed or pace, elevation, cadence, grade, vertical speed, temperature, respiration, and running and cycling dynamics such as vertical oscillation, stance time, torque and pedal smoothness. You only see the ones your device recorded.
A ride with power has two views, General (the charts above) and Advanced. Advanced shows the power curve full width, then an Advanced card worked out from the ride’s original recording, in groups: intensity (weighted power, variability, intensity against your FTP, load and efficiency), peak power (5 seconds to 20 minutes, with an FTP estimate at 95% of your best 20 minutes), cadence, drift, and time at power. Each group has a How it works ↗ link to the Form Academy article that explains it.
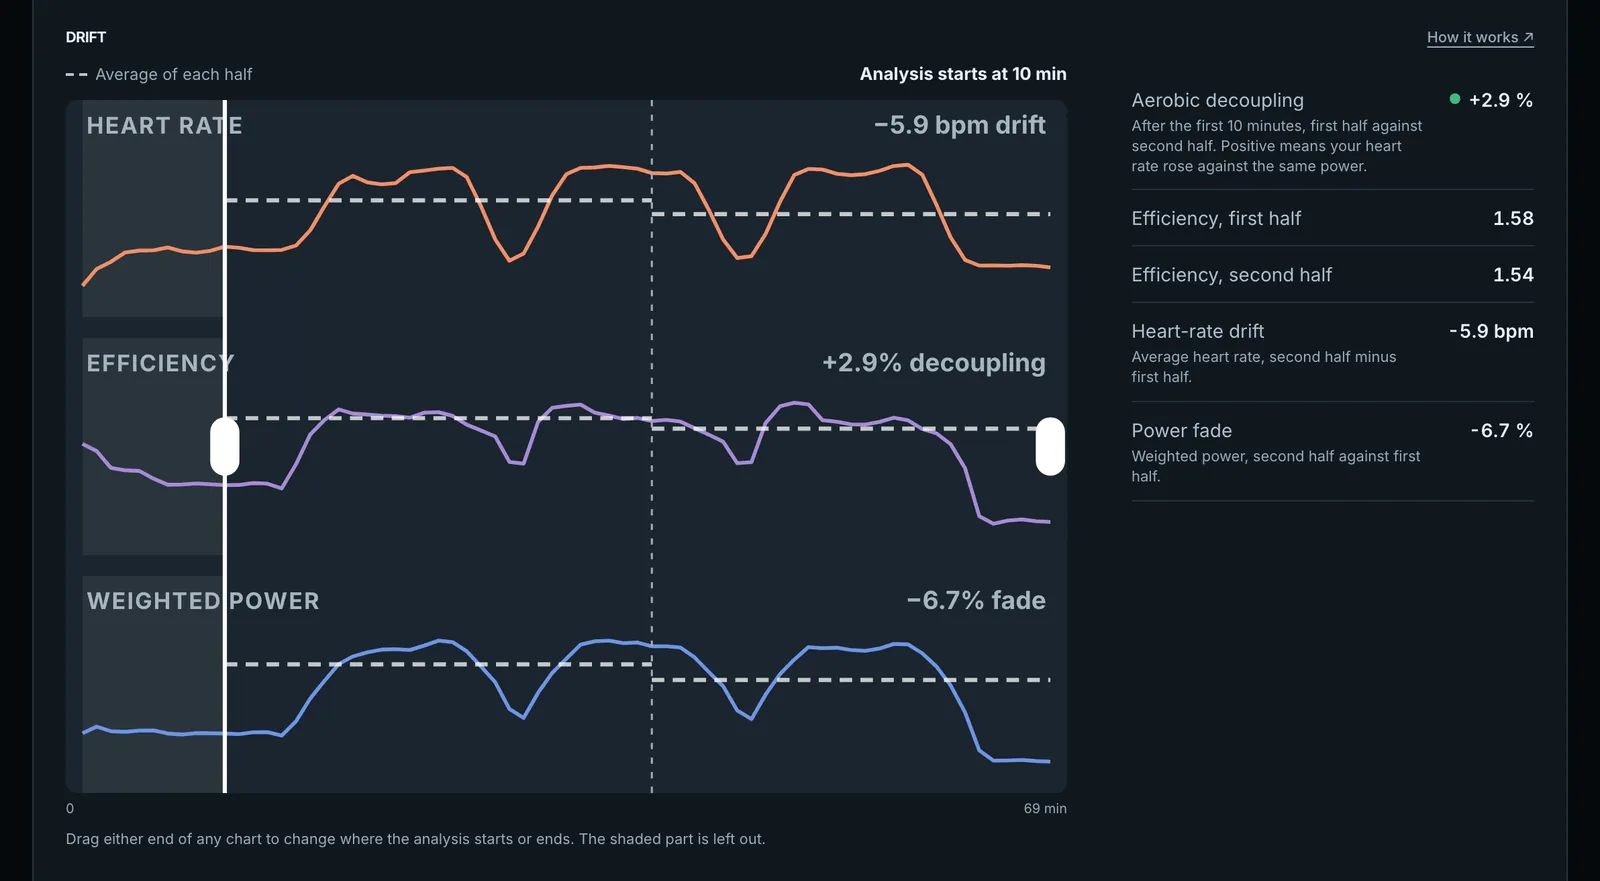
- Drift splits the ride into two halves after a 10-minute warm-up, which is shaded and left out. The three charts show heart rate, efficiency (power per heartbeat) and power, with a dashed line for each half’s average.
- Drag either end of any chart to move where the analysis starts or ends, for example to leave out a long cool-down. The figures update as you drag.
- Aerobic decoupling is how much your efficiency dropped from the first half to the second. A green dot means under 5%, amber 5–10%, red over 10%. Heart-rate drift is the second half’s average heart rate minus the first’s, and Power fade is the change in power. On a variable ride (lots of surges) the card says to treat it as a guide.
- With under 20 minutes left after the warm-up it says “Not enough ride to judge.”, and with too many gaps in power or heart rate, “Too many dropouts to judge.”
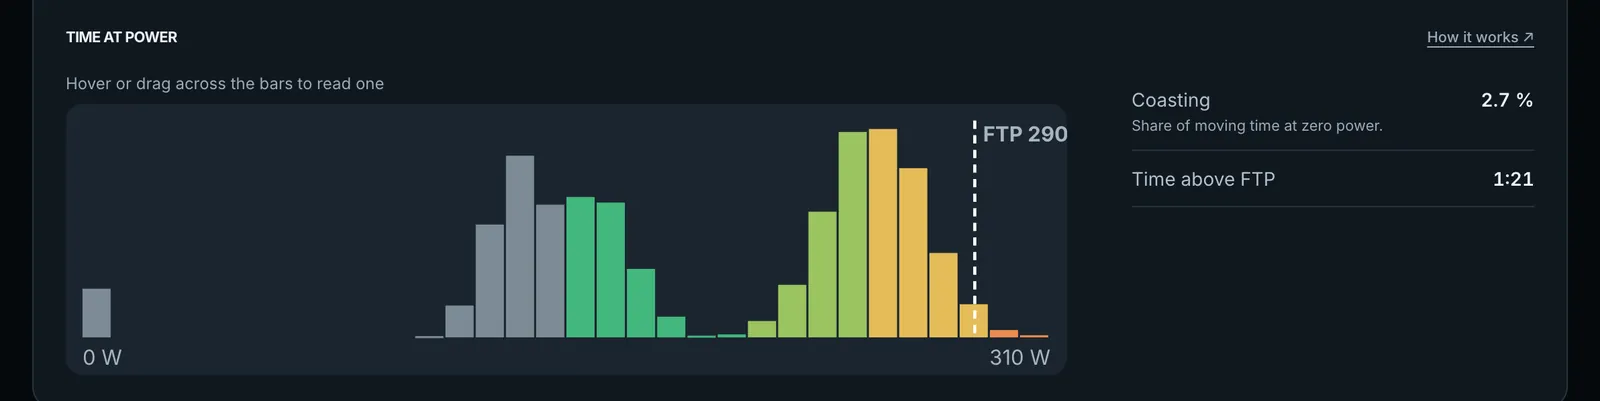
Time at power is a bar for each 10 W band, coloured by power zone, with your FTP marked. Hover or drag across the bars to read one. Coasting is the share of moving time at zero power, and Time above FTP the total time over it.
Splits
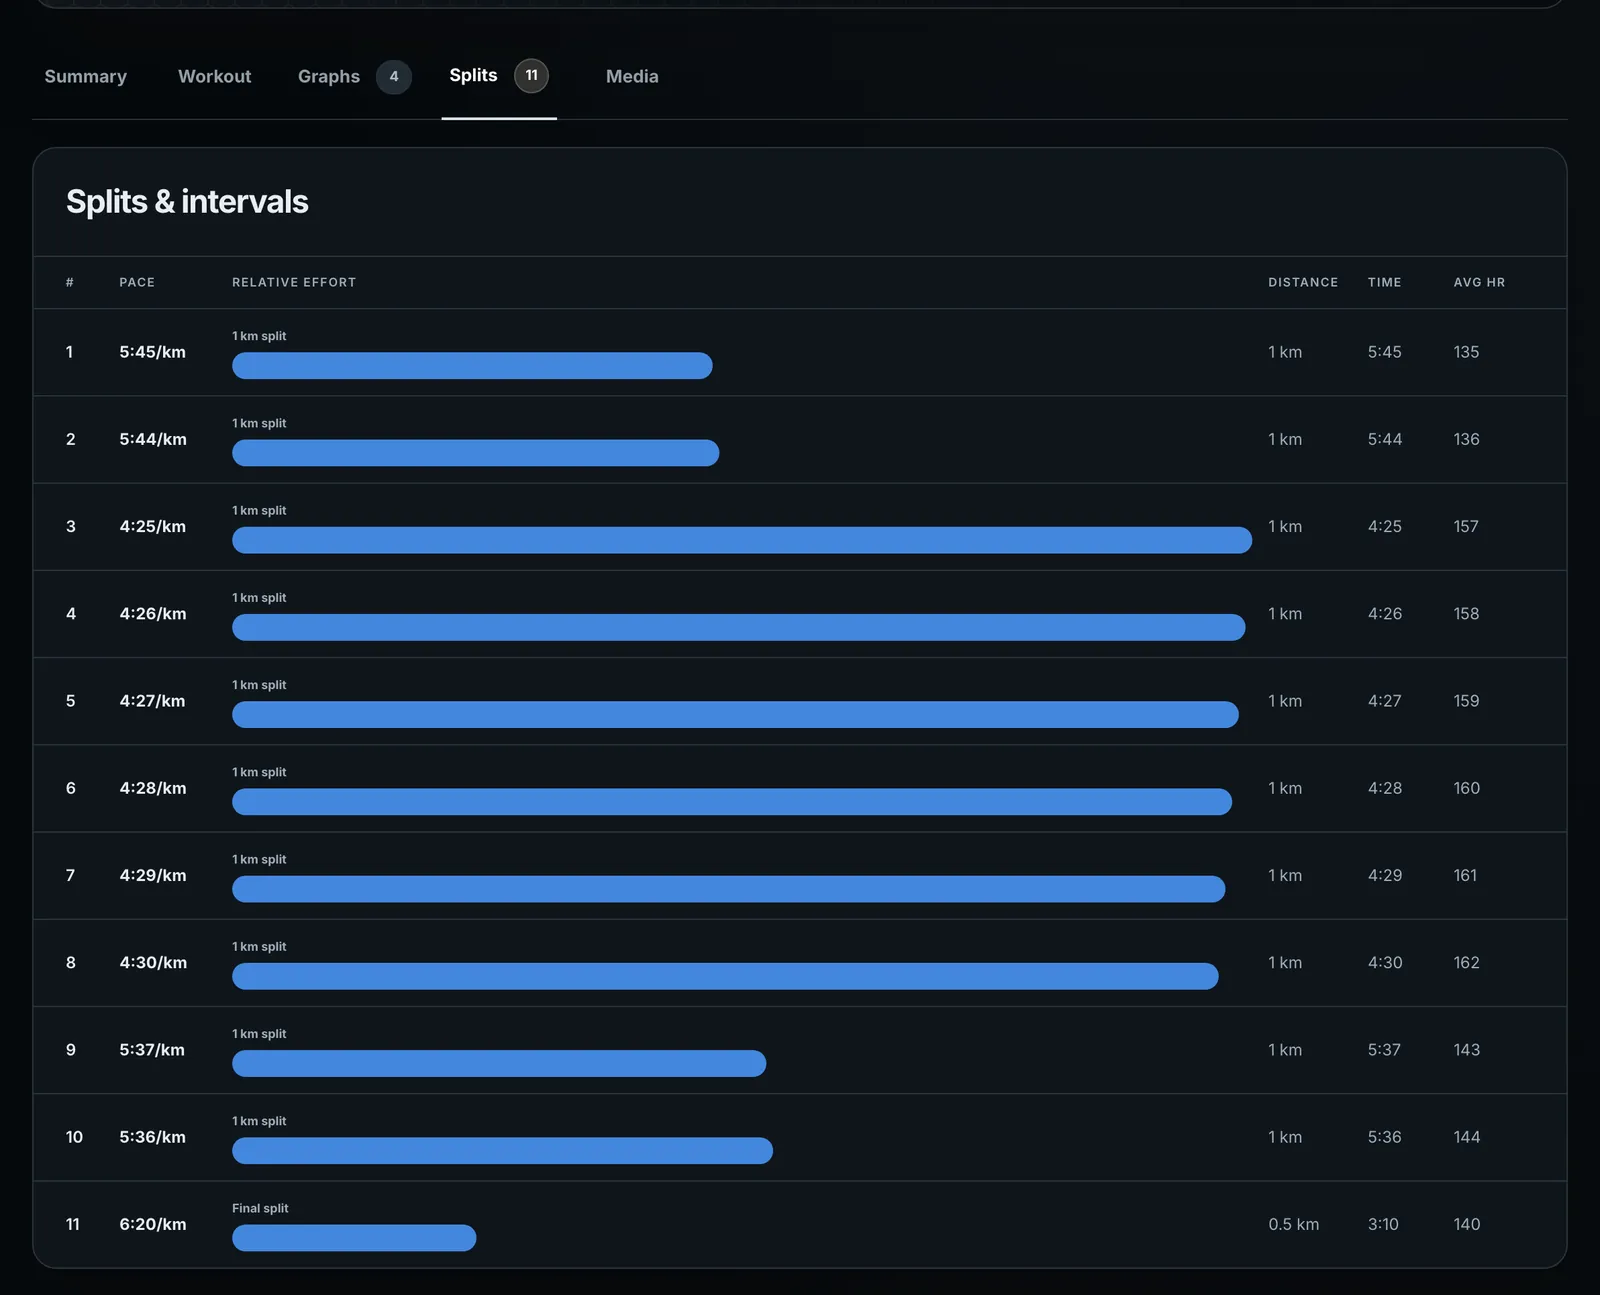
Splits lists each kilometre or lap with its pace (or speed, or power), a bar for relative effort, distance, time and average heart rate. Where laps are grouped into a workout step, press the number on the row to open the laps inside it.
Media
The Media tab holds the photos and videos you add to a session, and is where you share them. See “Share a session”.
What each download gives you
- FIT file is your device’s original recording, byte for byte, for a watch or phone upload. For an Intervals.icu session Form fetches the original from Intervals.icu if it has one, otherwise the FIT Intervals.icu built. For a trainer ride Form writes a FIT from the ride’s one-second data.
- TCX has the laps and every recorded second, for apps that take TCX.
- GPX is your route with heart rate, cadence and power.
- Splits is a CSV with one row per lap and a summary row, for a spreadsheet. Run cadence is in steps per minute.
Triathlons and other multisport races
A multisport file (triathlon, duathlon, brick) is stored as one session per leg so each leg is scored for its own sport, but it is shown as one race. On Activities it is a single row. On each leg’s page a race strip at the top shows the type and number of legs, total time, distance and load, and a bar of the legs, with the one you are viewing highlighted. The FIT download from any leg is the whole race file.
Delete a session
Delete asks you to confirm, so a stray click does nothing. It removes the session from Form, and for an upload it removes the stored file too. For a race, deleting one leg deletes the whole race, and the button says “Delete race”. A session that came from Intervals.icu can come back at the next sync, so to remove it for good, delete it in Intervals.icu as well.
When something is missing or goes wrong
- “No high-resolution stream available.” on Graphs means the source gave Form summary numbers but no second-by-second data.
- “No recorded laps or structured intervals were available for this activity.” on Splits means the same for laps.
- A banner saying Intervals.icu is temporarily unavailable means you are looking at the last saved copy. Reload later to refresh laps and signals.
- A download that fails shows its reason beside the menu and saves nothing, for example that the original file is no longer on Form, or that Intervals.icu needs reconnecting.
- A session with no route shows no map and no GPX download.
What happens next
A rename is saved straight away and shows wherever the session appears, including the calendar. The session’s load feeds your training load on Trends.
Common questions
- Why does Form say my load is “from heart rate”?
- The session had no power or pace to score it with, so Form estimated the load from your average heart rate against your threshold. It is an estimate, and the page says so. Intervals.icu sessions keep Intervals.icu’s own load.
- Why is there no Advanced view on my ride?
- Advanced needs power. Drift, efficiency and time at power also need the ride’s full-rate recording with heart rate, which Form reads from the original file. A ride synced without one shows its General charts only, or an Advanced view that says what is missing.
- Can I edit a session’s distance or time?
- No. Form shows what was recorded. You can rename it and add photos or videos.
- I deleted a session and it came back.
- It came from Intervals.icu, which Form syncs from. Delete it in Intervals.icu as well. Sessions from your phone, trainer or an upload stay deleted.