
Read your Trends
Totals, fitness and fatigue, weekly rhythm and recovery over the period you pick, plus cycling power analysis.
Updated 4 November 2026
Trends shows how your training adds up over weeks and months, and how one period compares with the one before. The Overview tab covers all your sports: totals, training load (your fitness and fatigue), weekly rhythm, consistency and recovery. Cycling, Running and Swimming look at one sport’s performance, and Strength at your gym work. Trends only reads your sessions; nothing on it changes your plan.
Where to find it
Where to find it
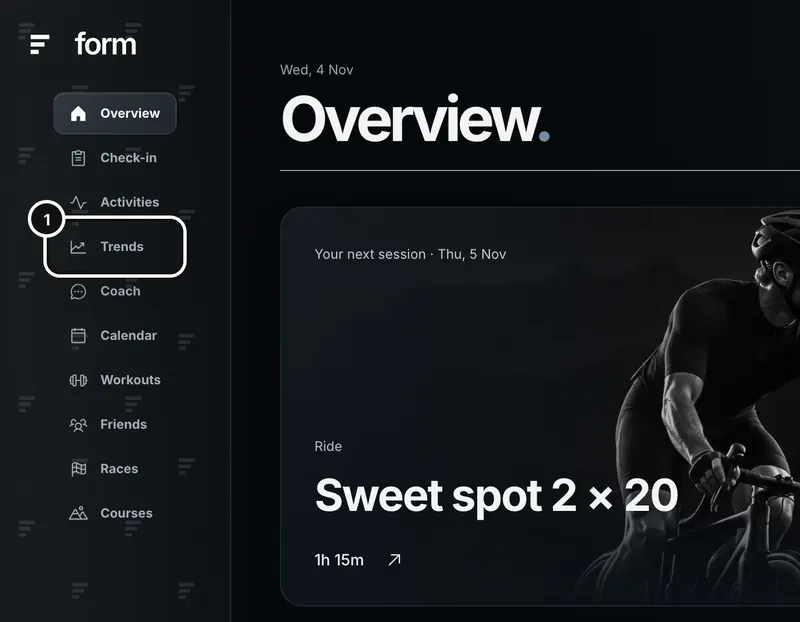
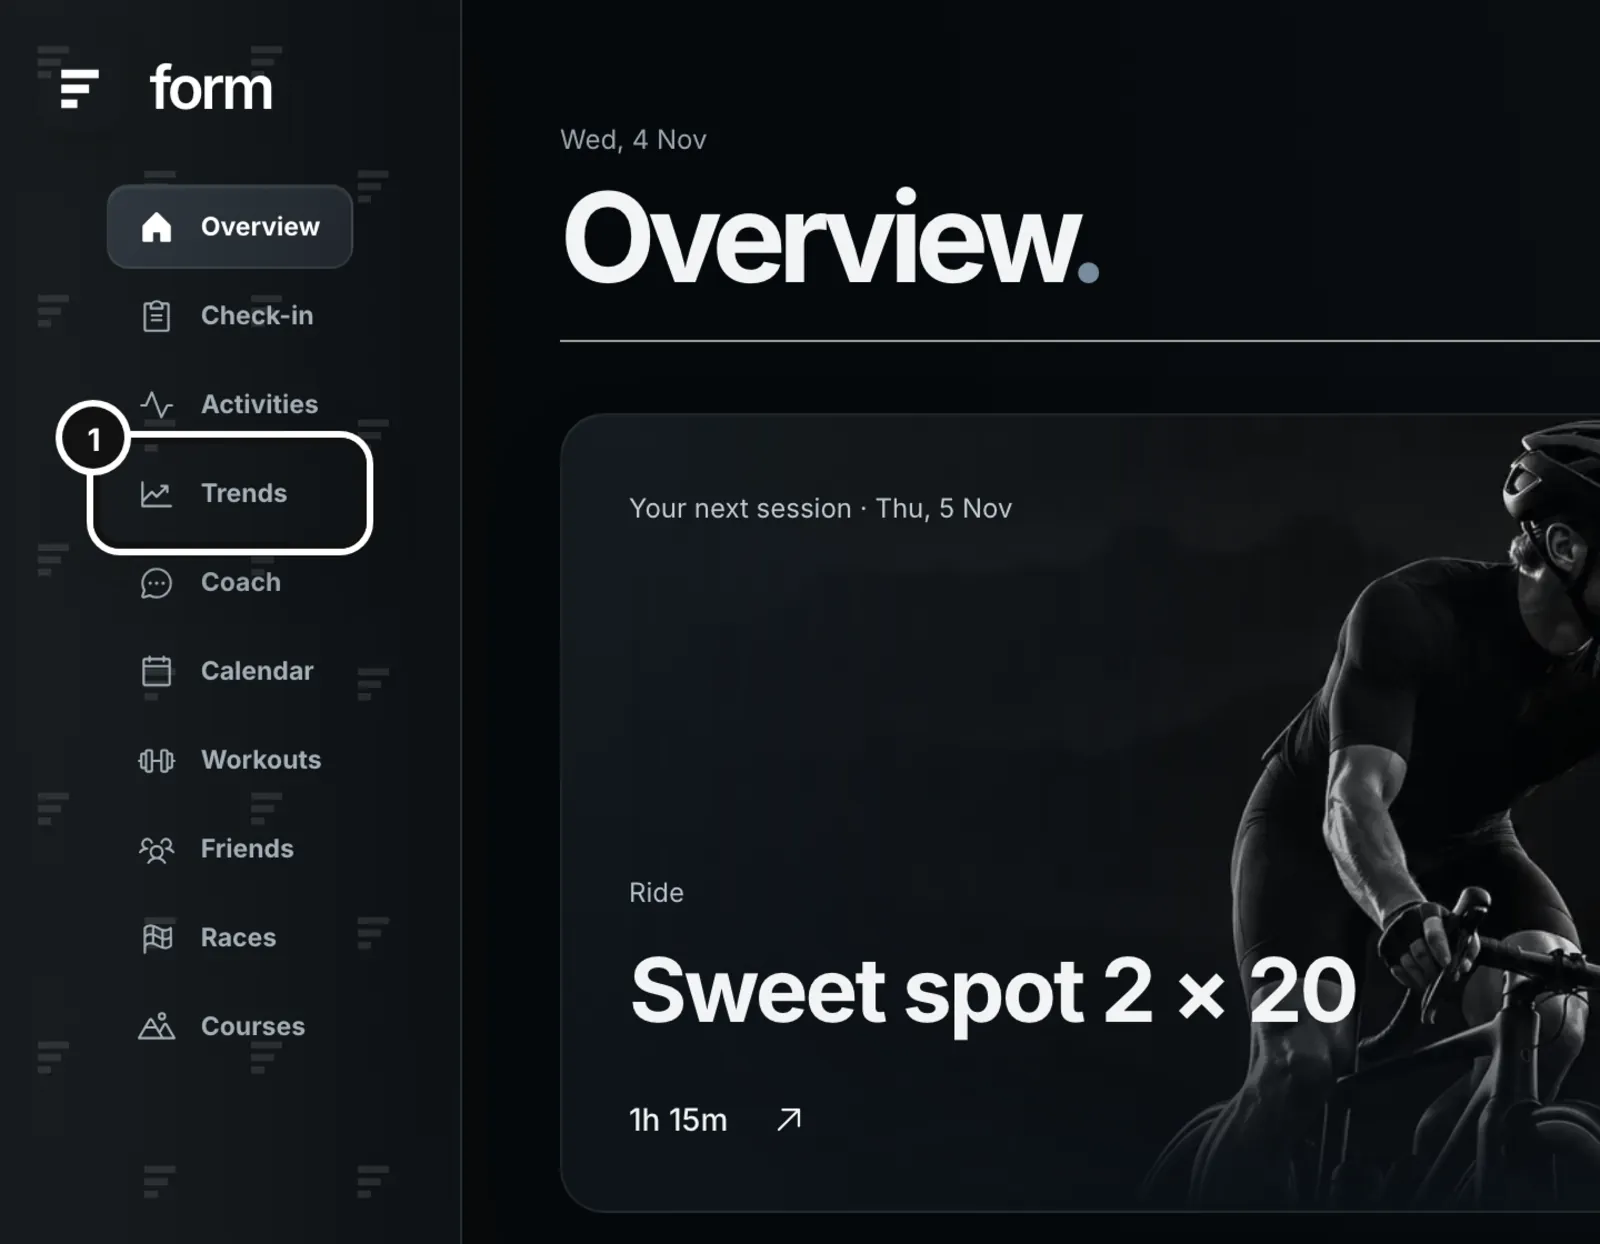
1Click Trends in the left sidebar. You can also press the Trends card on Overview or the Trends button on Activities. On a phone-width browser, Trends is under More in the menu along the bottom.
Choose a period
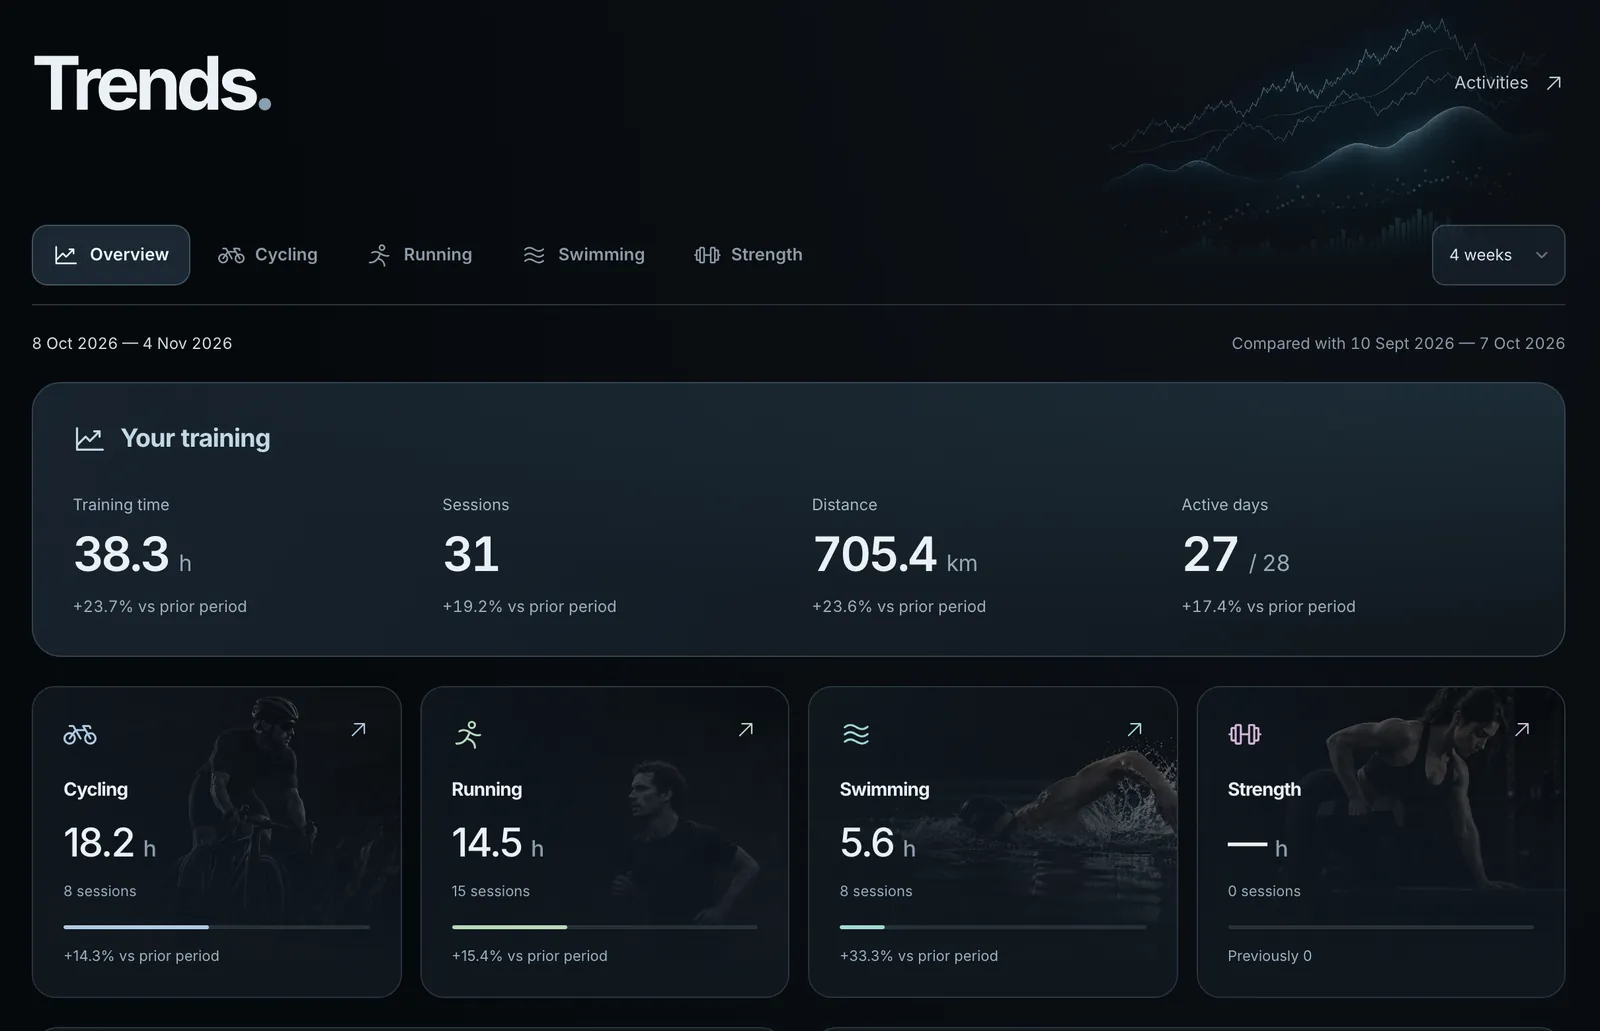
The tabs along the top are Overview, Cycling, Running, Swimming and Strength. The period on the right is 4 weeks, 12 weeks (where it starts), 26 weeks or 52 weeks. Underneath, the left date range is the period you are looking at and the right one is the period of the same length just before it, which every comparison on the page uses. Activities ↗ at the top right goes back to your list of sessions.
Your training
- Training time, Sessions, Distance and Active days (days with at least one session, out of the days in the period) add up the period.
- Under each one is the change against the prior period, such as “+19.2% vs prior period”. “Previously 0” means the prior period had none; “No prior comparison” means there is nothing to compare with.
- On the Overview tab, a card for each sport shows its hours and sessions, a bar for its share of your training time, and its change in sessions. Press a card to open that sport’s tab.
Training load: fitness and fatigue
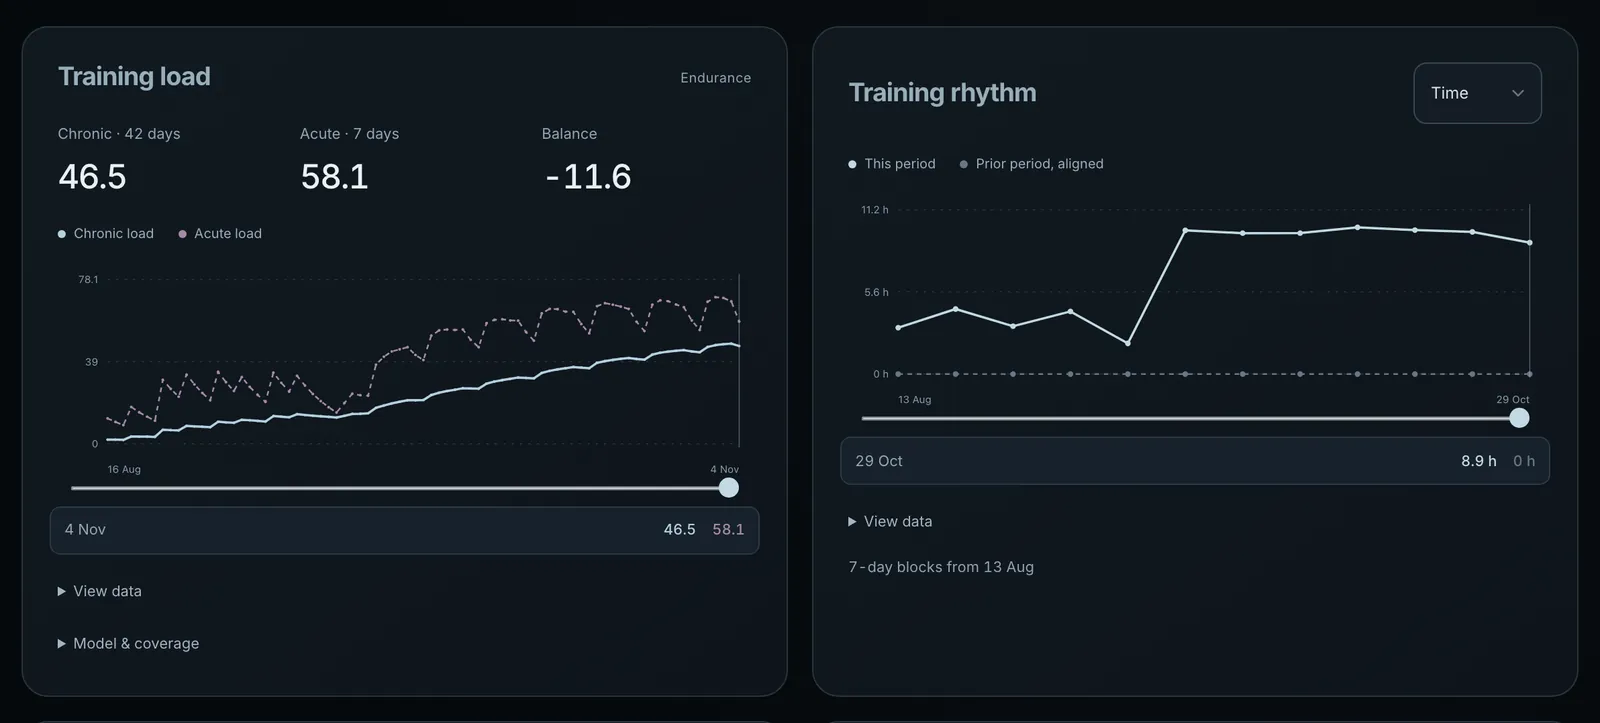
Training load is on the Overview tab. It is built from the load of each session, one number for how hard it was, worked out by the source that recorded it or by Form.
- Chronic · 42 days is your fitness: a slow average of your daily load. Each day moves it one forty-second of the way towards that day’s load, so a hard week lifts it a little and a quiet week lowers it a little.
- Acute · 7 days is your fatigue: the same sum over a seven-day window. It jumps after a hard block and drops quickly after rest.
- Balance is fitness minus fatigue, often called form. Negative means you have trained more lately than you are used to; around zero or above means you are fresher.
The chart draws Chronic load and Acute load across the period. Form works through every day from your first scored session, counting a rest day as zero, and leaves gym sessions out on purpose, so a leg day never reads as an easy ride. Model & coverage says how many sessions in the period have no load score. Those are left out, so the numbers read lower than your real load, never higher.
Rhythm, consistency and recovery
- Training rhythm charts your training in 7-day blocks from the start of the period, with the same weeks of the prior period lined up underneath (Prior period, aligned). The menu switches between Time, Distance and Load.
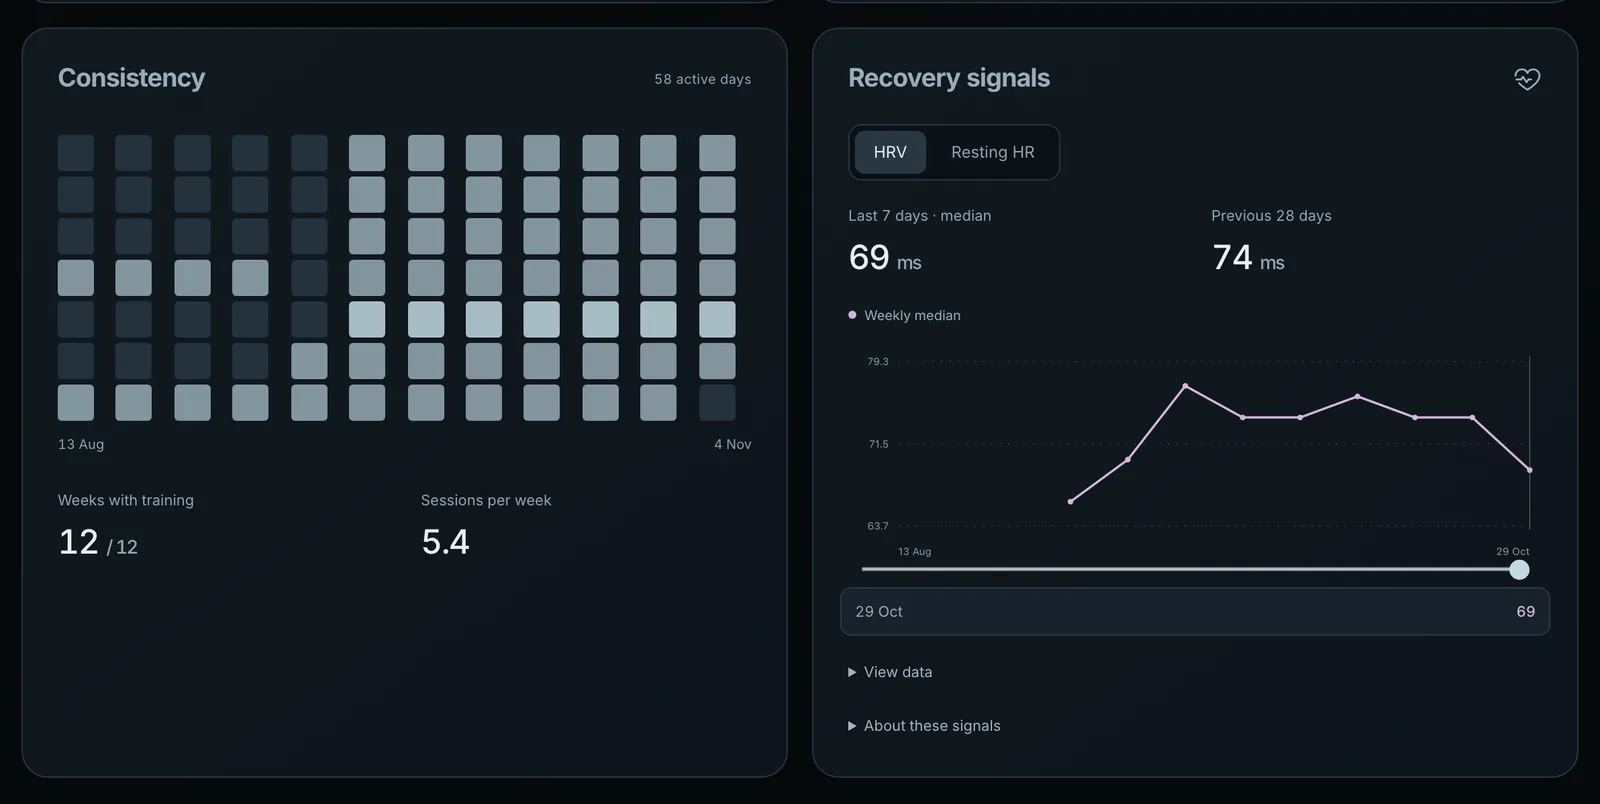
- Consistency has a square for each day, lit when you trained, plus Weeks with training and Sessions per week.
- Recovery signals, on the Overview tab, shows HRV or Resting HR from your wellness data: the median of the last 7 days against the 28 days before, and a weekly median chart. Compare readings from the same device and routine; these don’t diagnose anything.
Every chart works the same way: hover over it, click it, or move the slider underneath to read one point. Session ↗ opens the session behind a point, and View data shows the chart’s numbers as a table. At the bottom of each tab, Sessions behind the numbers lists the sessions in the period; Show more sessions adds more.
Cycling
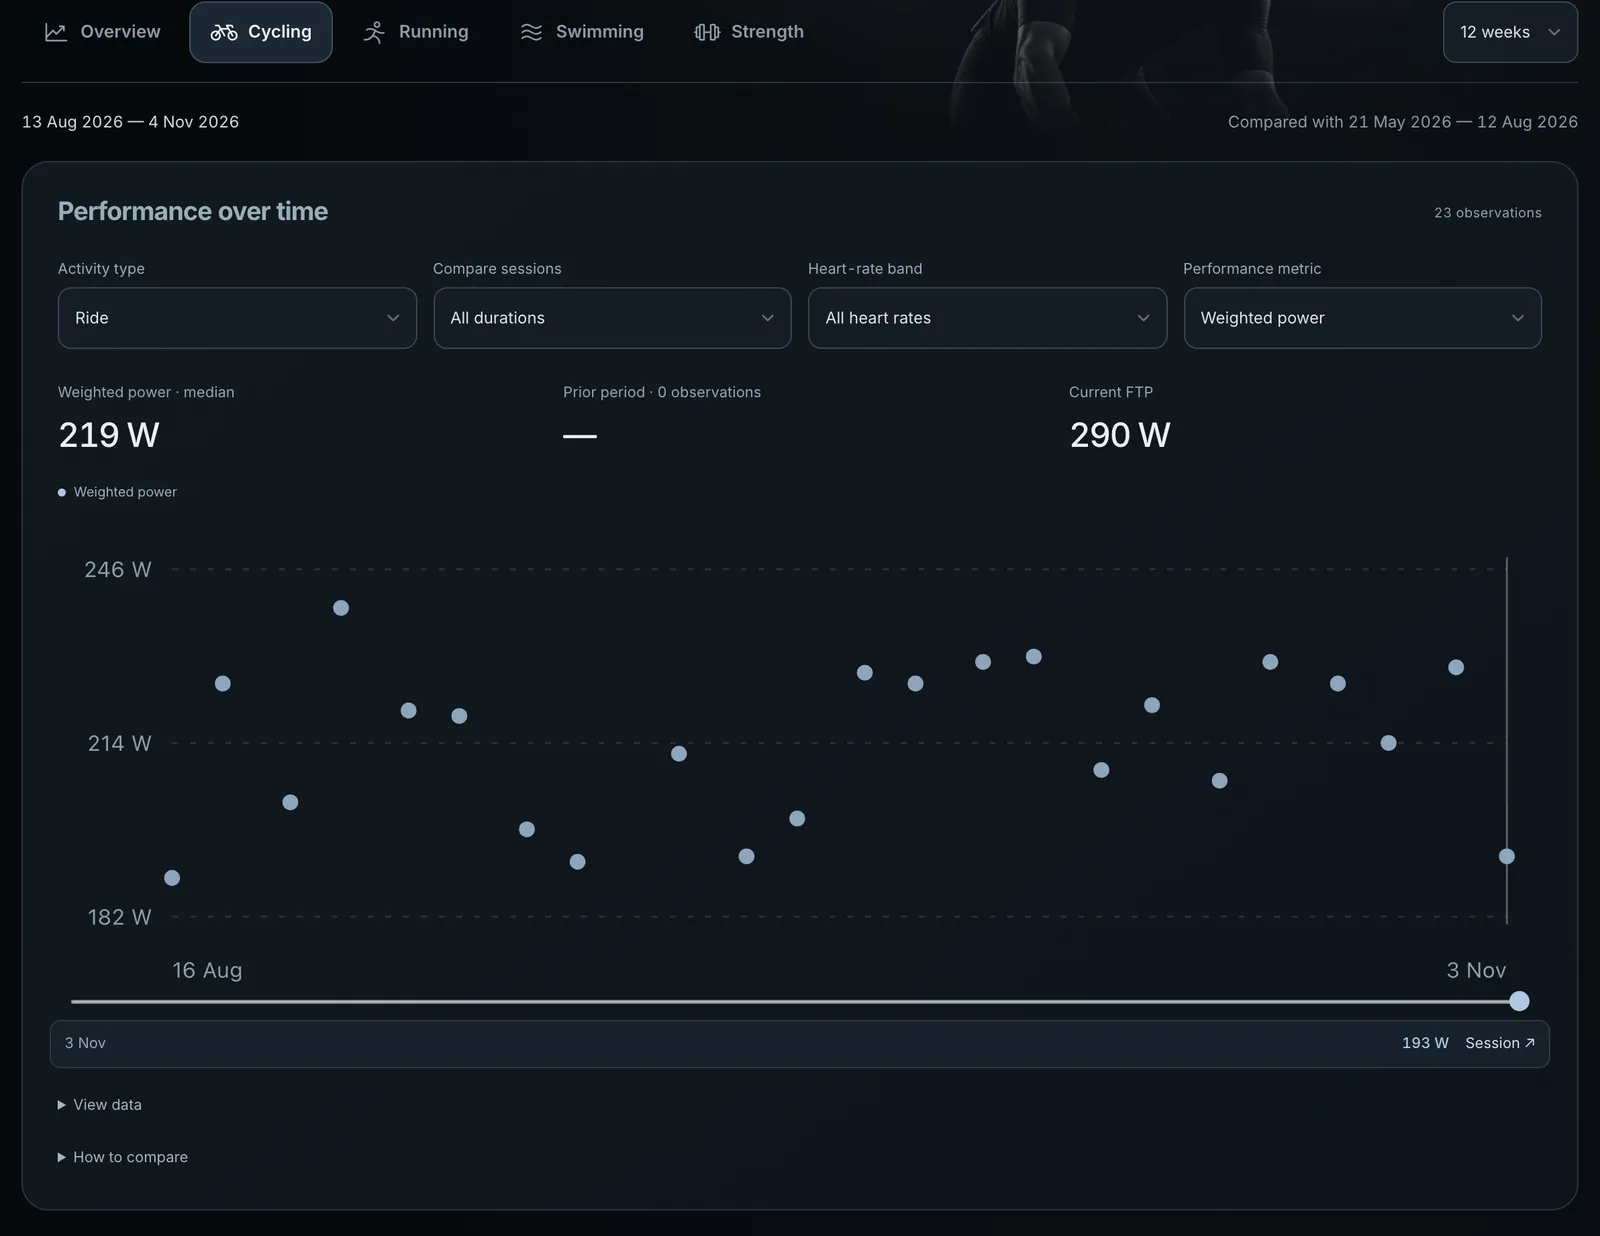
- Performance over time puts each ride on the chart as a dot, by its weighted power or, if you choose, its average heart rate. Narrow it to rides of a similar length (under 1 hour, 1–2 hours, 2+ hours) or heart-rate band so you compare like with like. It shows the median for this period and the prior one, and your current FTP. How to compare explains what can skew it, such as weather, hills and pauses.
- Power-duration curve: your best average power for 5 seconds, 1, 5, 20 and 60 minutes in this period, against the prior period.
- Climbing: total ascent and the most in one session, for outdoor rides or, with Virtual, trainer rides on Form’s courses.
- Efficiency and drift: one dot per ride for efficiency (power per heartbeat), decoupling, heart-rate drift, power fade, weighted power and variability (how surgy the ride was), one tab each. Decoupling, drift and fade only count steady rides, measured after the first 10 minutes. The line under the chart explains each one and says how many rides in the period have it. It needs at least three rides.
- Power late in a ride: your best 5-minute power after 500, 1,000 or 1,500 kJ of work in the same ride, a way of tracking how well you hold power when tired.
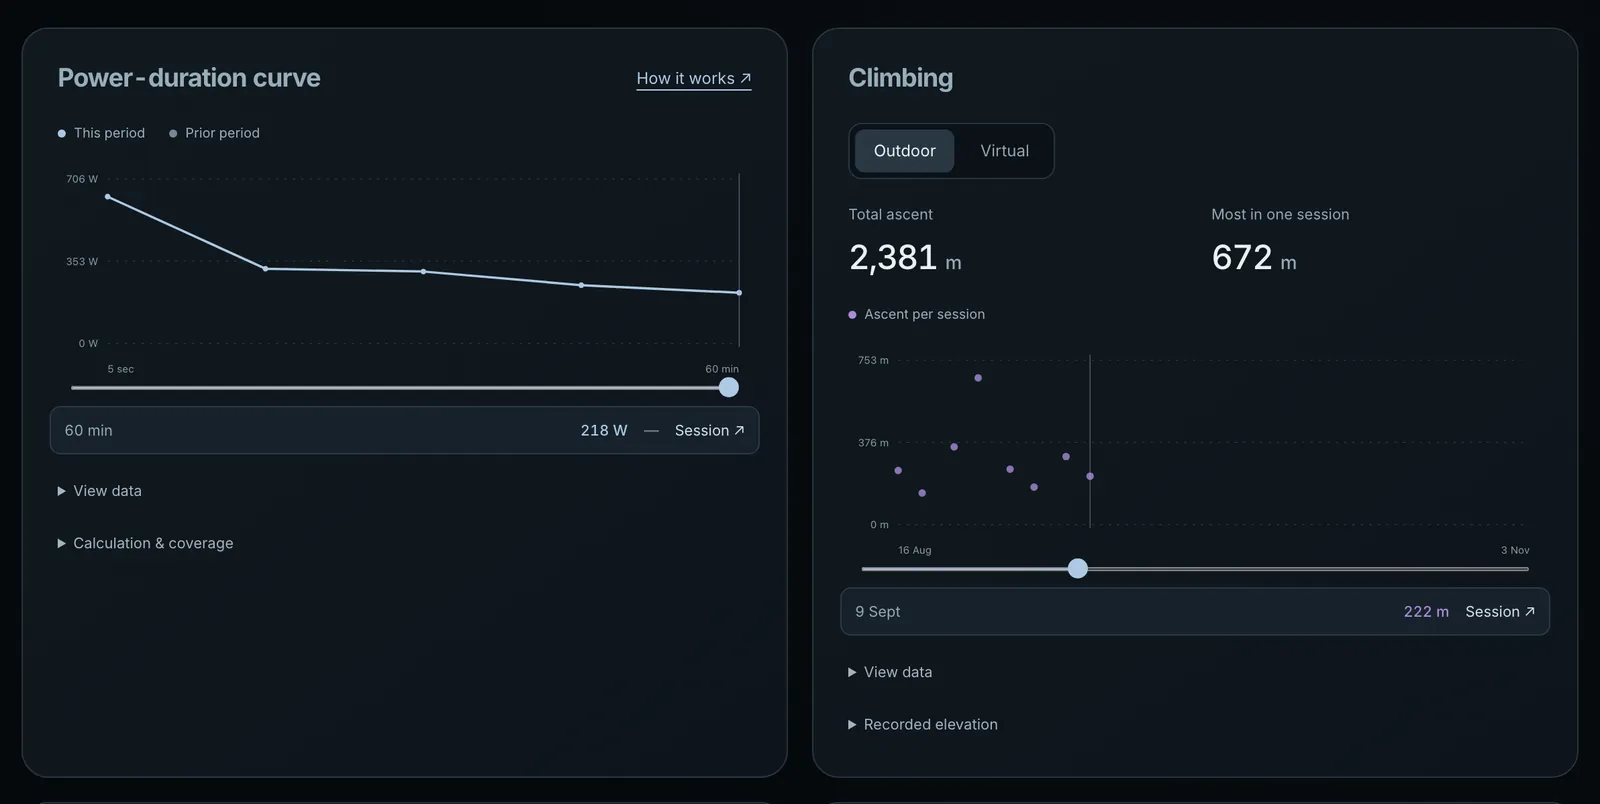
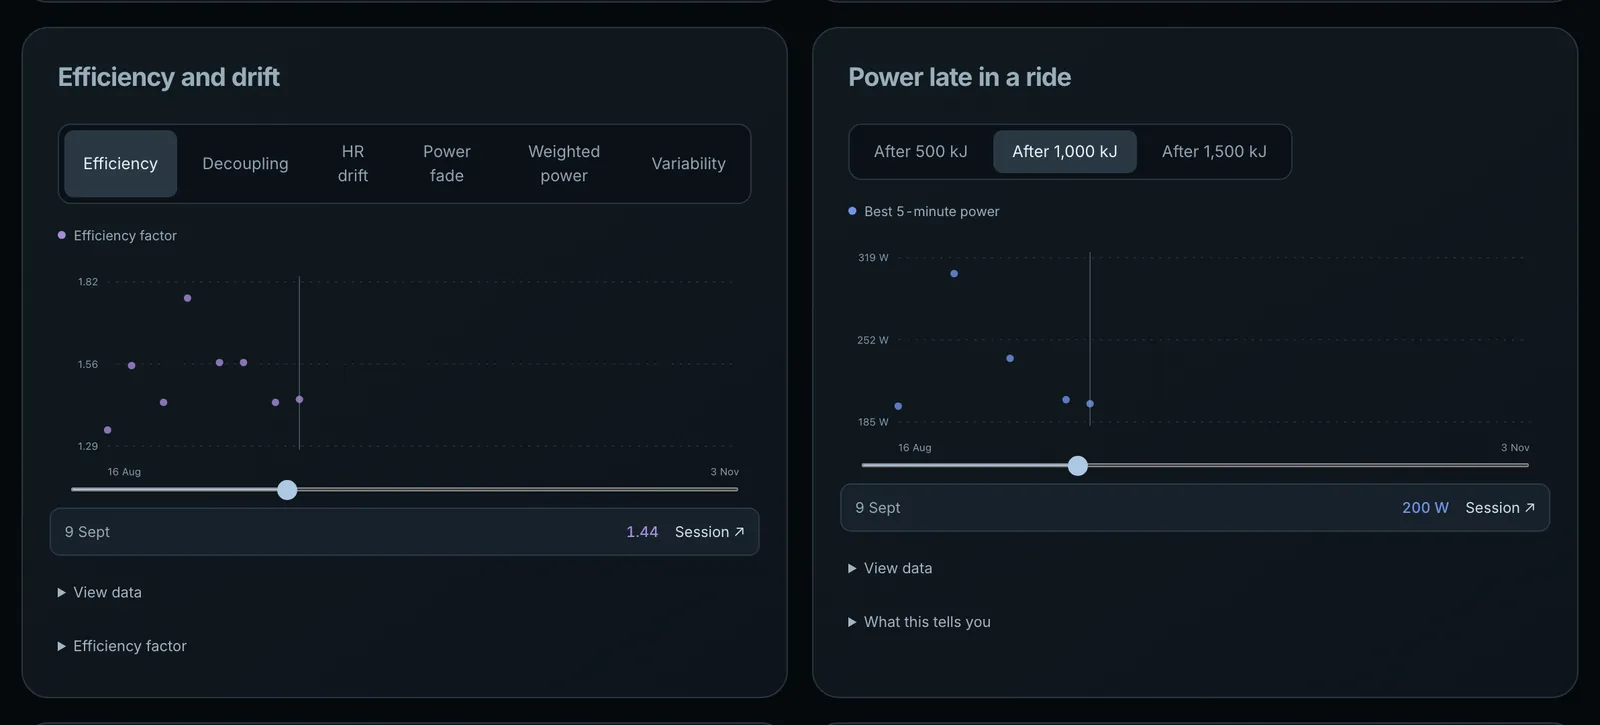
The power-duration curve, efficiency and drift, and power late in a ride need each ride’s full second-by-second power, which Form reads from the original file: a Garmin ride, an uploaded .fit file or a ride recorded in Form. While it reads them the cards say “Reading original recordings · 5 remaining”. A ride without a full recording still counts in your totals and in Performance over time. Calculation & coverage under the curve says how many rides in the period qualify.
Running and swimming
- Performance over time works as for cycling (pick the activity type, length and heart-rate band), with moving pace (or heart rate) and distance bands: under 5 km, 5–10 km and 10+ km for runs, under 1 km, 1–2 km and 2+ km for swims.
- Distance benchmarks shows your fastest whole-session pace for sessions within 2% of each distance (3 km, 5 km, 10 km and 21.1 km for runs; 400 m, 1 km, 1.5 km and 2 km for swims), against the prior period. They are training benchmarks, not race results.
- Running also has Climbing, the same as cycling.
Strength
The Strength tab shows the gym sessions you log in the Form app: your records and progress by exercise. Until you have logged one it says “Log a strength session to see your progress.”
What happens next
A new session shows on Trends the next time you open it. The coach reads the same training load, so when you ask how your fitness is going it quotes these numbers. To change what you do next, ask the coach or edit your calendar.
Common questions
- Why does every card say “Previously 0”?
- The prior period has no sessions, usually because you joined Form recently or your history doesn’t go back that far. Choose a shorter period, or upload older sessions.
- Why is my cycling analysis empty?
- The power curve, efficiency and drift, and power late in a ride need a ride’s full second-by-second power from its original file. Rides without one only count in the totals and Performance over time. Efficiency and drift also needs at least three rides with the figure in the period.
- Why is my fitness different from Garmin or Intervals.icu?
- Form counts each session once, uses the load the source gave it or its own estimate, leaves gym sessions out, and starts from zero on your first scored day. Small differences are expected. Model & coverage says how many sessions have no load.
- Is a negative balance bad?
- No. It means you have trained harder lately than your average, which is what a build is. Look for a long, deep negative together with feeling flat, and talk it through with the coach.